Safer Traffic Recovery from the Pandemic in London--Spatiotemporal Data Mining of Car Crashes
Authors
Kejiang Qian, and Yijing Li
Background
In the aim to support London’s safer recovery from the pandemic by improving road safety intelligently, this study investigated the spatiotemporal patterns of age-involved car crashes and affecting factors, upon answering two main research questions: (1)”What are the spatial and temporal patterns of car crashes as well as their changes in two typical years, 2019 and 2020, in London, and how the influential factors work?”; (2)”What are the spatiotemporal patterns of casualty by age groups, and how people’s daily activities affect the patterns pre- and para- the pandemic”?
Aim & Methodology
Three approaches, i.e., spatial analysis (network Kernel Density Estimation, NetKDE), factor analysis, and spatiotemporal data mining (tensor decomposition), had been implemented to identify the temporal patterns of car crashes on weekly and daily basis respectively, detect the crashes’ hot spots, and to gain better understanding the effect from citizens’ daily activity on crashes’ patterns pre- and para- the pandemic. It had been found from the study that car crashes mainly clustered in the central part of London, especially busier areas around denser hubs of point-of-interest (POIs); the POIs, as a reflector for citizens’ daily activities and travel behaviours, can be of help to gain a better understanding of the crashes’ patterns, upon further assessment on interactions through the geographical detector; the crashes’ casualty patterns varied by age group, with distinctive relationships between POIs and crashes’ pattern for corresponding age group categorised.
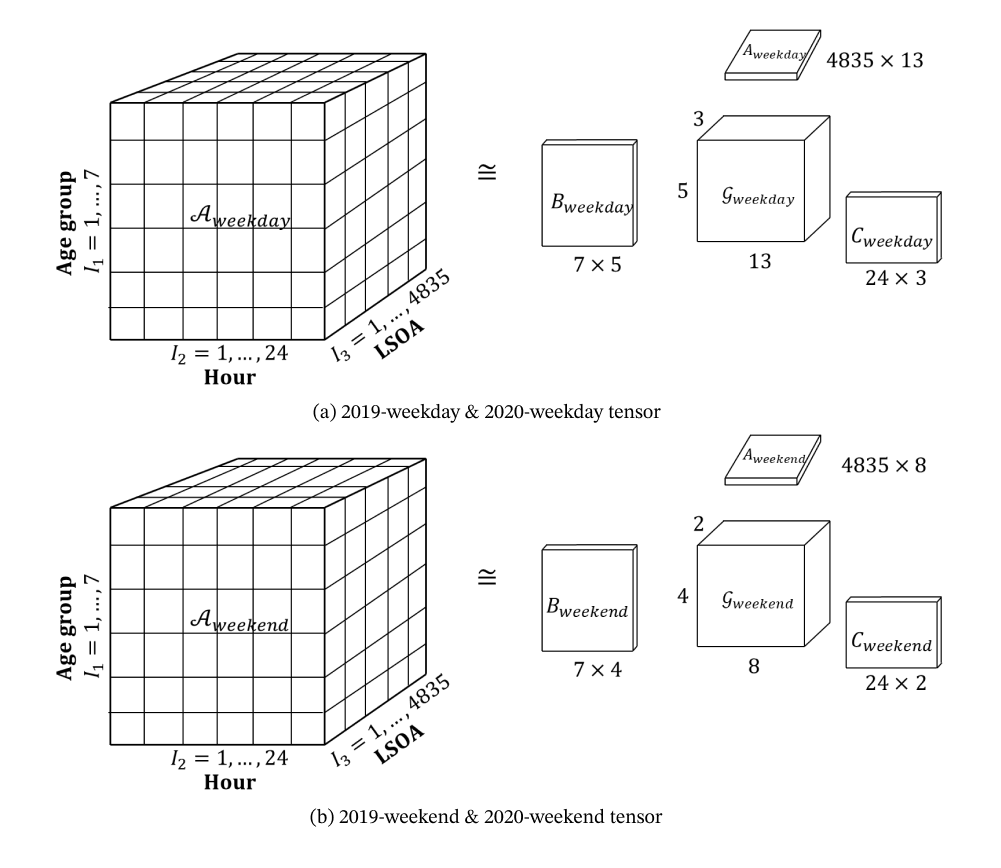
Figure 1: Tensor decomposition of tensors
Results
In all, the paper provided an in-depth exploratory analysis of car crashes and their casualty patterns in London to facilitate deployment policies towards post-pandemic safer recovery upon COVID-19.
Temporal patterns of car crashes
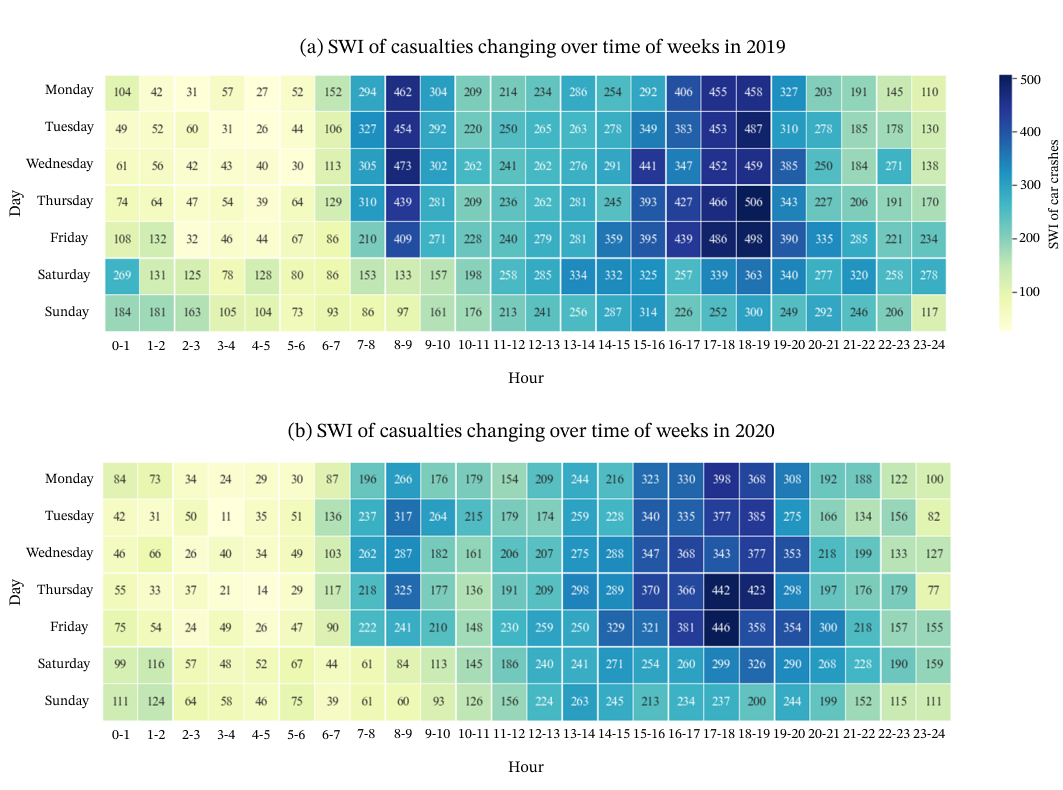
Figure 2: SWI of trafc crashes in each time of a week in 2019 & 2020.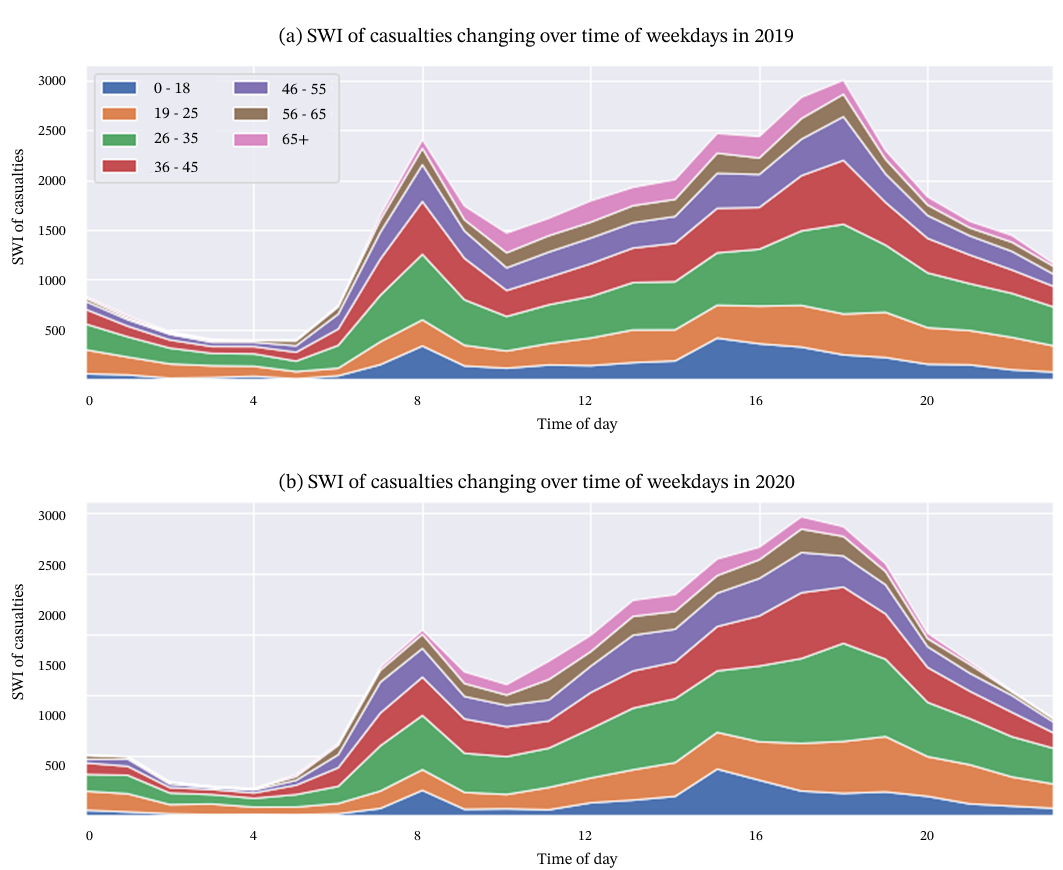
Figure 3: SWI index of casualties changing over time of weekdays in 2019 & 2020.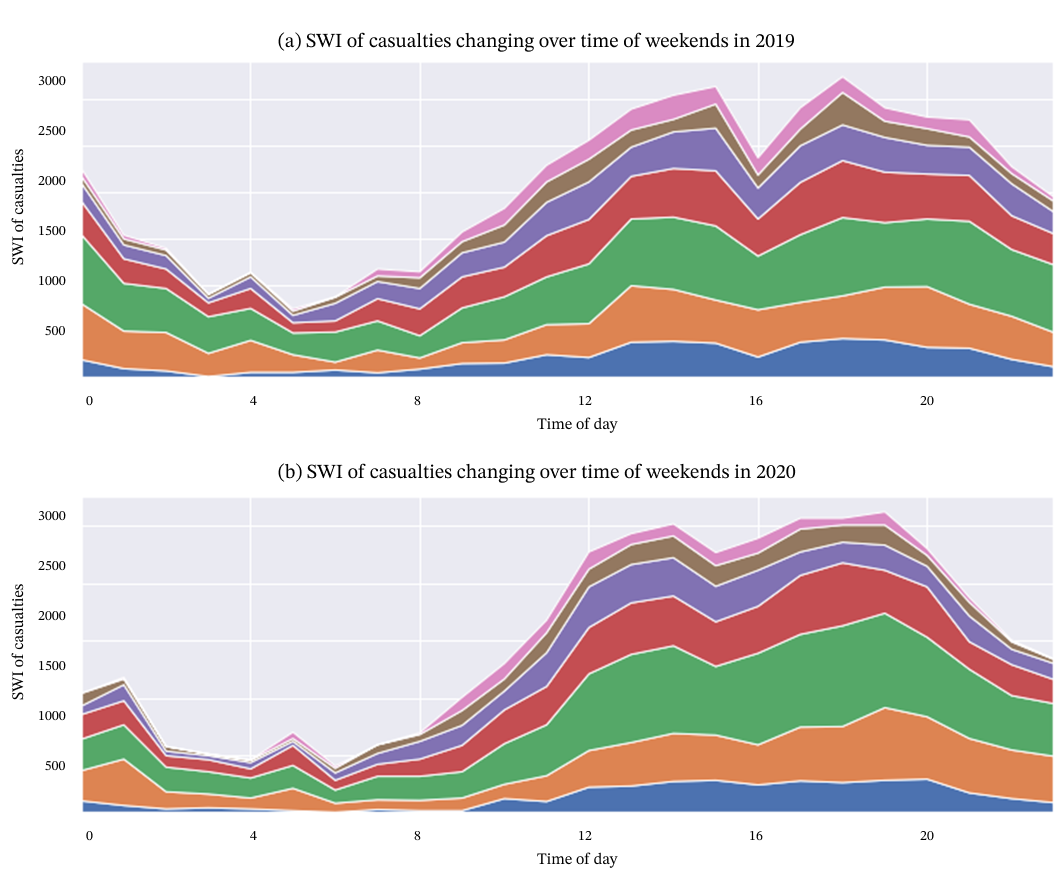
Figure 4: SWI index of casualties changing over time of weekends in 2019 & 2020.
Spatial Analysis of Road Trafc Crashes
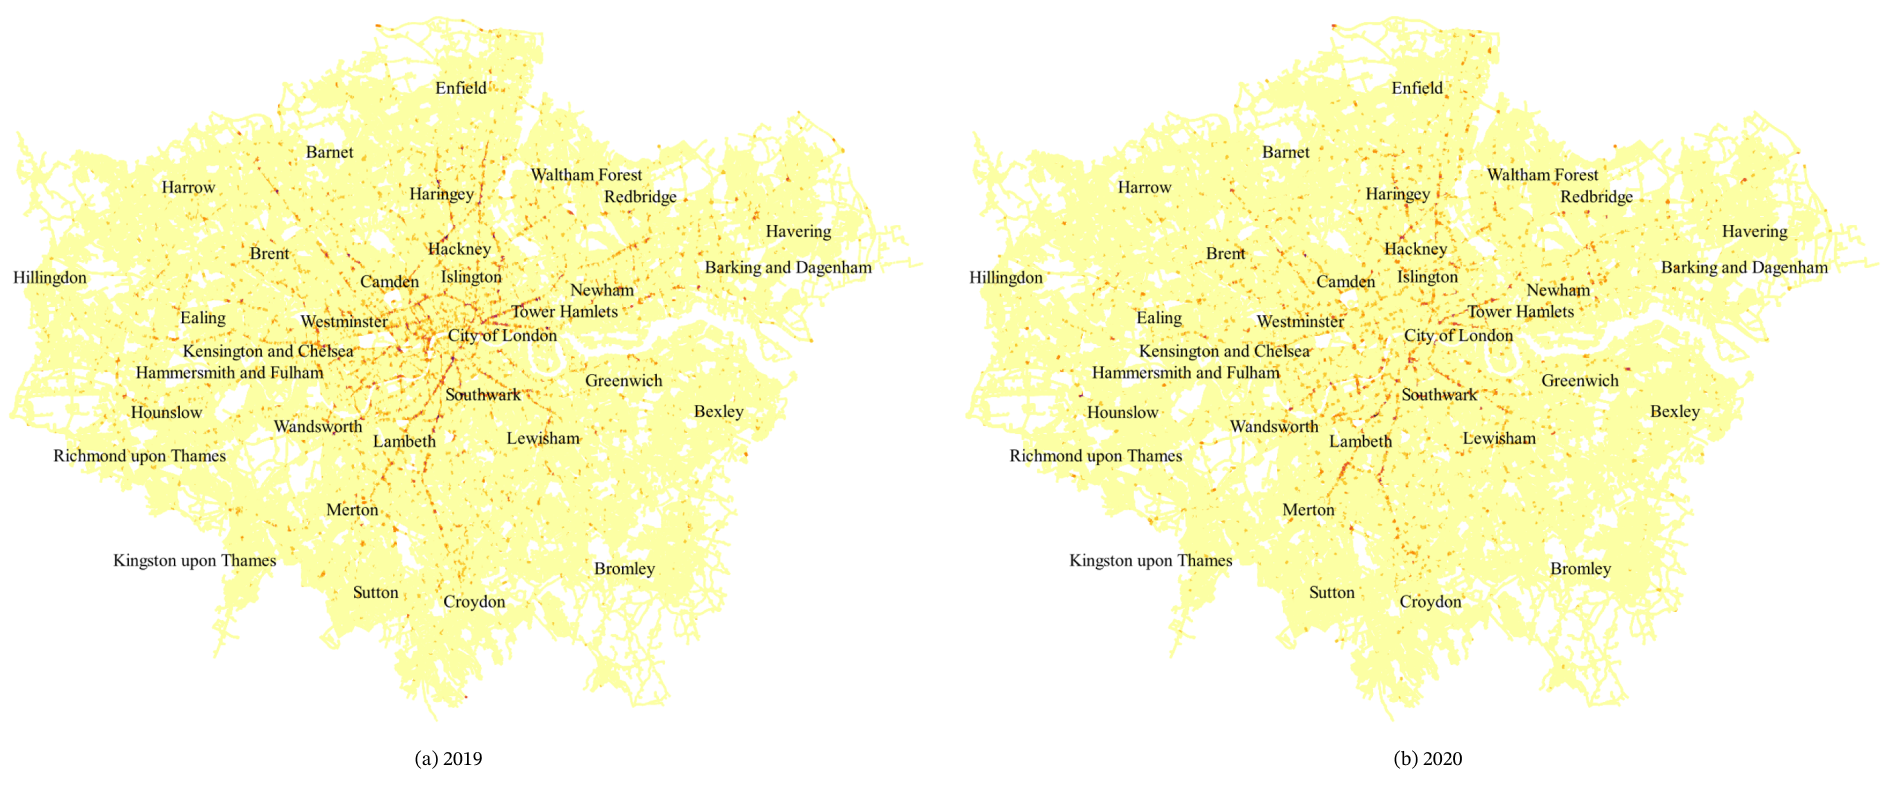
Figure 5: Network KDE of crashes in 2019 & 2020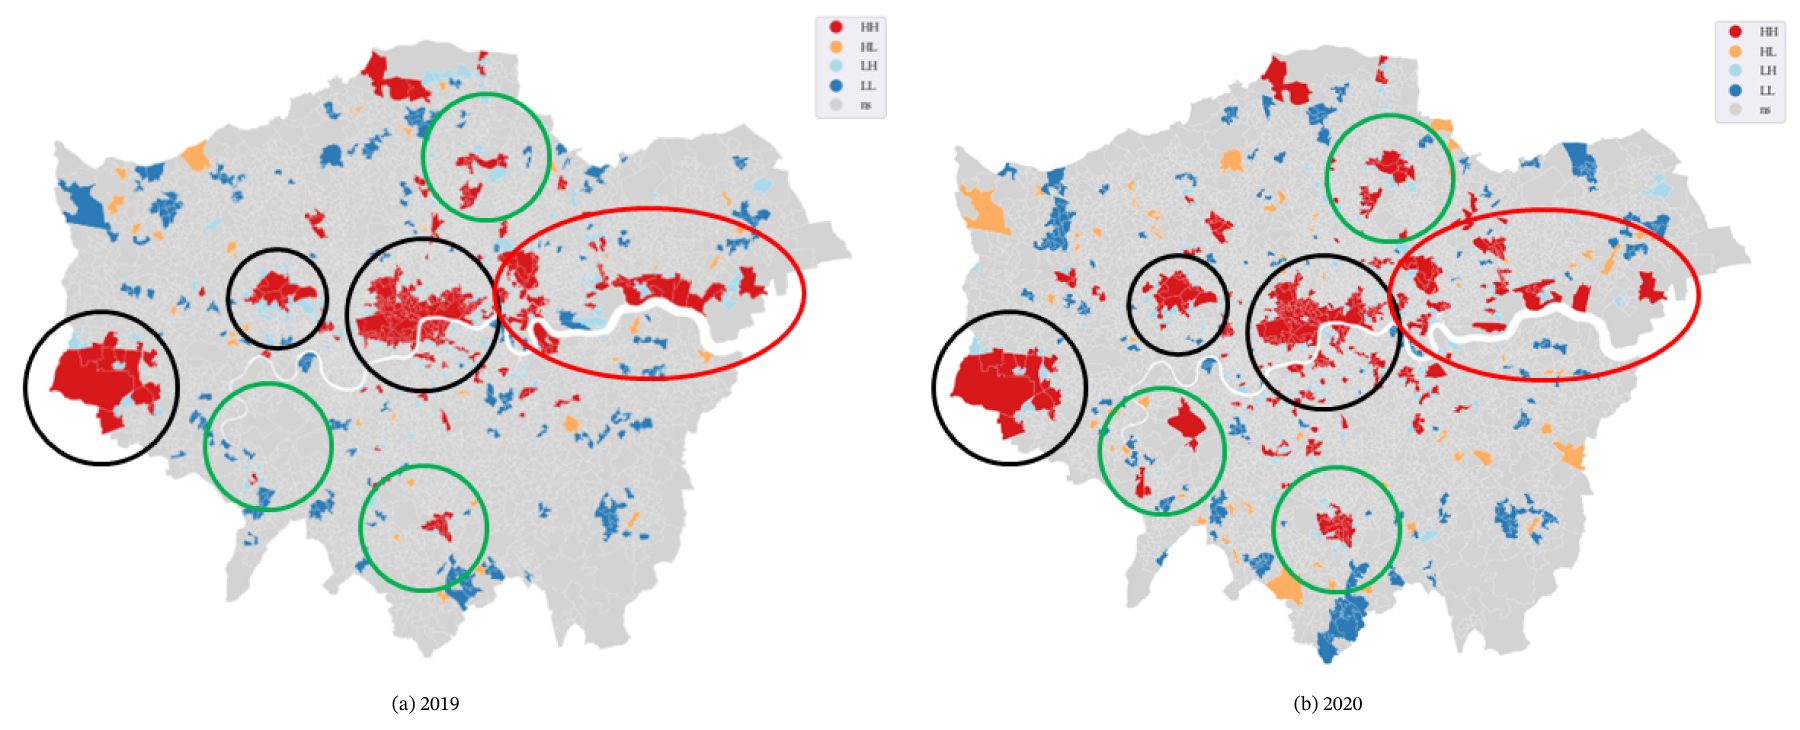
Figure 6: Local Indicators of Spatial Association (LISA) cluster map for crashes in 2019 & 2020
Pattern analysis of road trafc crashes during weekdays and weekends
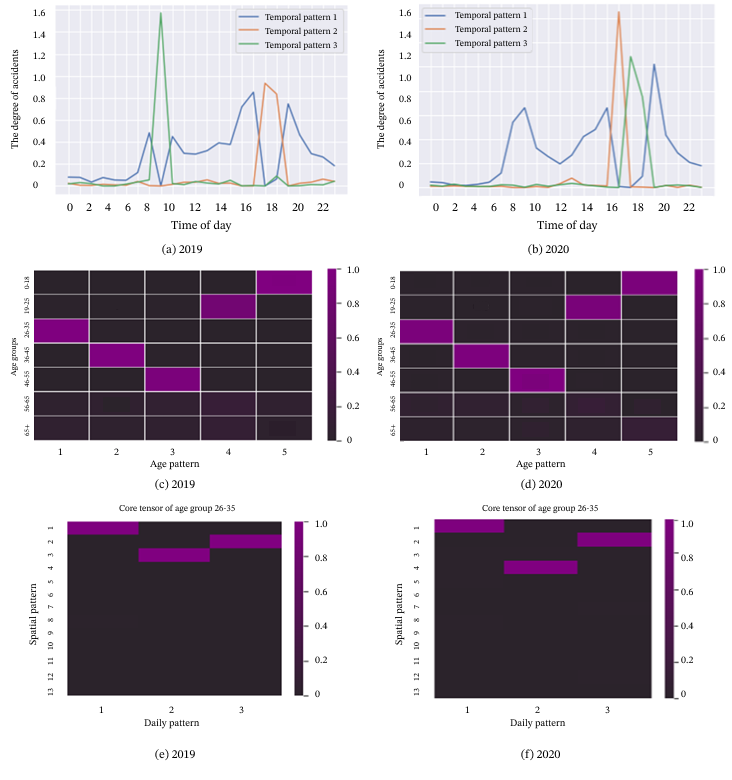
Figure 7: Decomposed patterns of 2019-weekday & 2020-weekday tensor. (a) and (b) Temporal pattern; (c) and (d) Age pattern; (e) and (f) Examples of matrices of Core tensor. The matrices of core tensor are only for illustrating our workfow but not for comparative analysis, so one example of this matrix is shown for two years respective.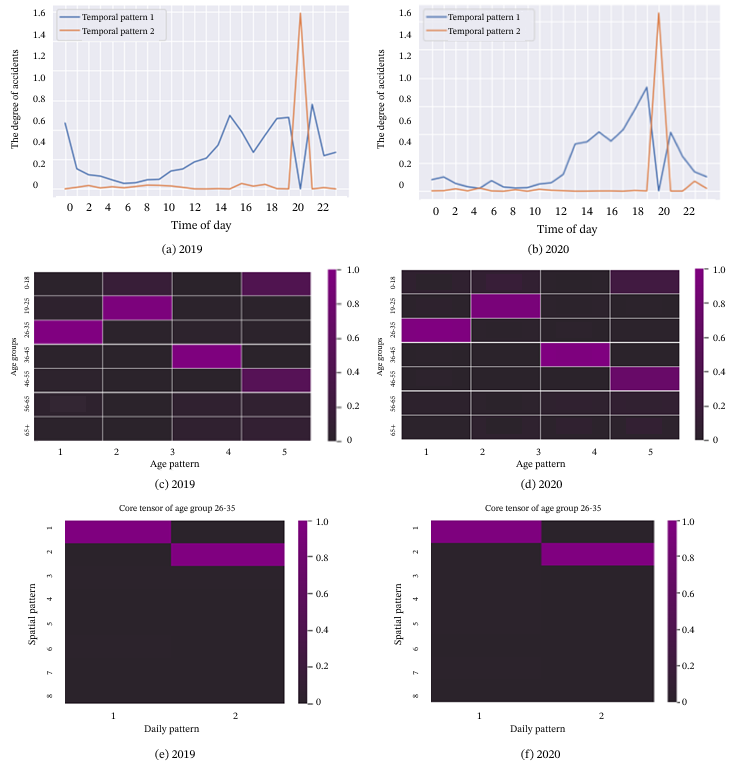
Figure 8: Decomposed patterns of weekday tensor. (a) Temporal pattern; (b) Age pattern; (c) Matrices of Core tensor.
Paper Link
View our code: Gitub
View our paper: Applied Spatial Analysis and Policy